Streamline Your Design Workflow: A Comprehensive Review of Chart, a Figma Plugin for Data Visualization
No results found
5/21/2024
Figma Plugins for Data Visualization: A Comprehensive Review

Designing visually appealing and insightful data visualizations is a challenging task. Thankfully, Figma, a powerful collaborative web-based interface design tool, offers several plugins that can simplify this task. One such plugin that has gained popularity amongst designers is Chart1. This blog post presents a comprehensive review of Chart, its features, its comparison with other chart plugins, and how it can be an asset for data visualization tasks.
Introduction to Chart
Chart is a powerful data visualization plugin that allows you to create various types of charts with random, tabular, or JSON data2. It is compatible with Sketch, Figma, or Adobe XD, making it a versatile choice for designers using different design tools.
Chart offers a rich collection of chart types and the ability to personalize charts with templates2. It provides easy data input options and real-time updates, significantly reducing the time designers spend creating and updating charts.
Chart vs. Other Plugins
While many other plugins assist with data visualization in Figma, Chart is noted for its versatility and user-friendly features. For instance, plugins like Datavizer and Charts offer different features and functionalities3.
Datavizer, developed by Amelia Wattenberger, allows you to plug in data, and it has a variety of chart elements3. However, in terms of the cleanliness of the output and interaction with the artboard, it falls short compared to Chart3.
On the other hand, the plugin named Charts is another popular choice for designers. It works well, but it does not provide the same level of customization and variety of chart types as Chart does3.
Key Features of Chart
Variety of Chart Types
Chart offers a wide array of chart types. Whether you want a bar chart, line chart, pie chart, or even more complex visualizations, Chart has got you covered2.
Personalization with Templates
Chart allows you to personalize your charts with templates. This feature enables you to maintain consistency in your designs, making your work look more professional2.
Easy Data Input
Chart ensures that you can easily input your data, whether it is random, tabular, or JSON2. This ease of input reduces the time spent on data entry and allows you to focus more on the design aspect.
Real-Time Updates
With Chart, what you see is what you get. The plugin provides real-time updates, so you can instantly see the impact of any changes you make2.
Wrap Up
Data visualization is an essential aspect of UI/UX design. It can make or break the user experience. With the right plugin, such as Chart, the task of creating effective data visualizations can become significantly easier.
Chart's extensive features, customization options, and user-friendly interface make it a superior choice for data visualization in Figma. If you are a designer looking to streamline your workflow and create stunning data visualizations, Chart is worth a try2.
Call to Action
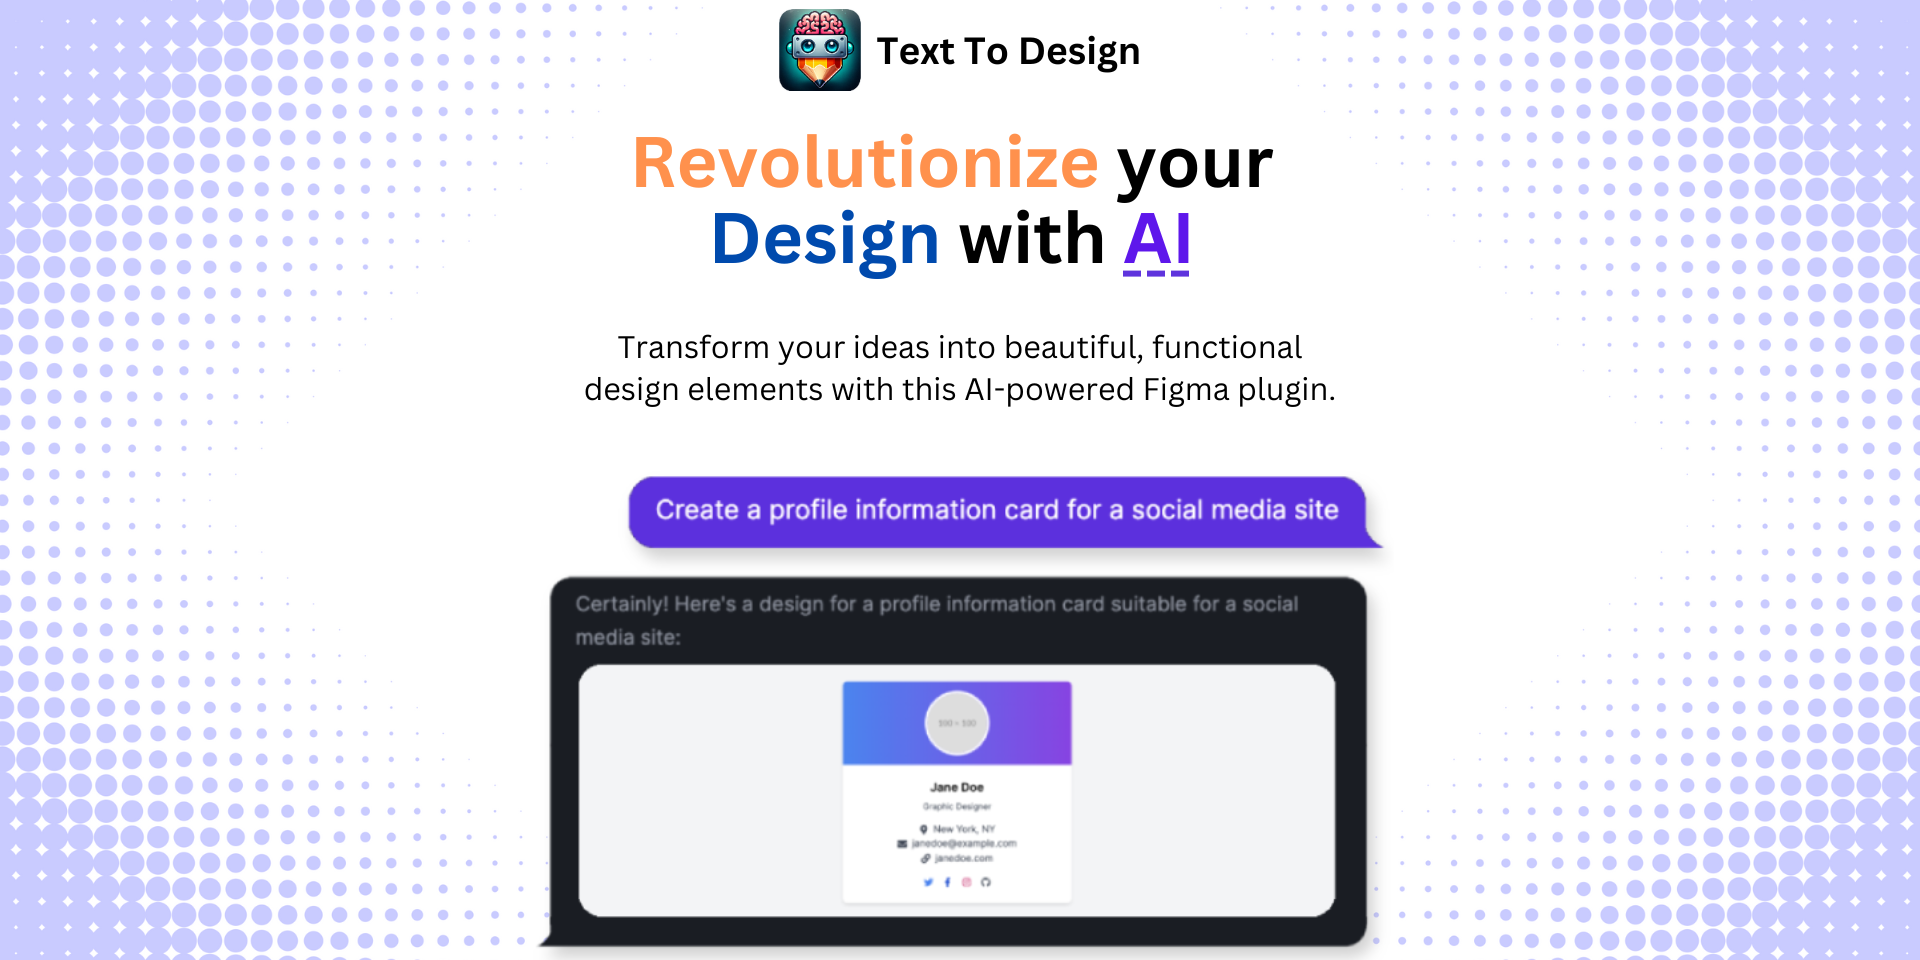
Harness the power of AI with our advanced Figma plugin, Text To Design AI Assistant. This AI-powered plugin transforms your text descriptions into innovative design ideas, making it an ideal tool for designers, developers, and creative teams.
Experience a new way of designing today. Try Text To Design AI Assistant to elevate your Figma designs to the next level.
Footnotes
Step Into the Future of Design with your AI Copilot
Join +40K designers revolutionizing their workflow with AI. Install our Text-to-Design plugin in just a few clicks to unlock your creative potential. Start for free and instantly generate designs for your project.